Custom Business Dashboards Built Around Your Data
Turn live business data into information you can actually use. Media Booth® builds custom dashboards that connect your systems, track the numbers that matter and give your team a clearer picture of what is happening across your business in real time.
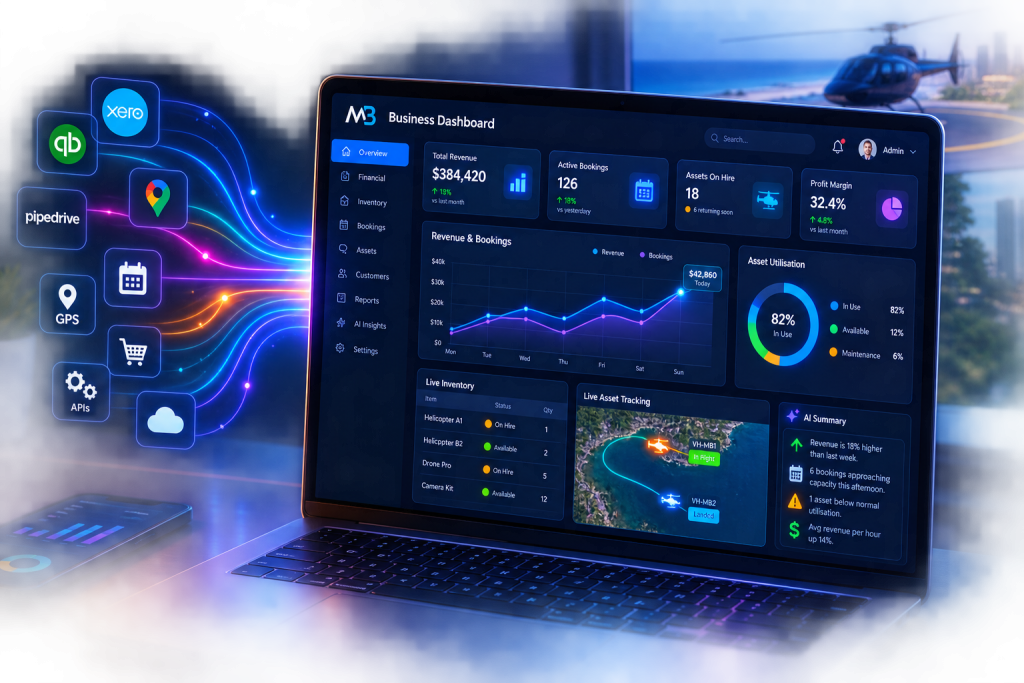
See What Is Happening Across Your Business Right Now
Most businesses have plenty of data. The problem is that it is spread across accounting platforms, CRMs, booking systems, inventory software, spreadsheets, GPS platforms, supplier systems and other applications.
Media Booth® builds custom business dashboards that bring this information together into one clear view. Instead of waiting for reports or manually comparing systems, your dashboard can continuously collect, process and display the information your team needs to make better decisions.
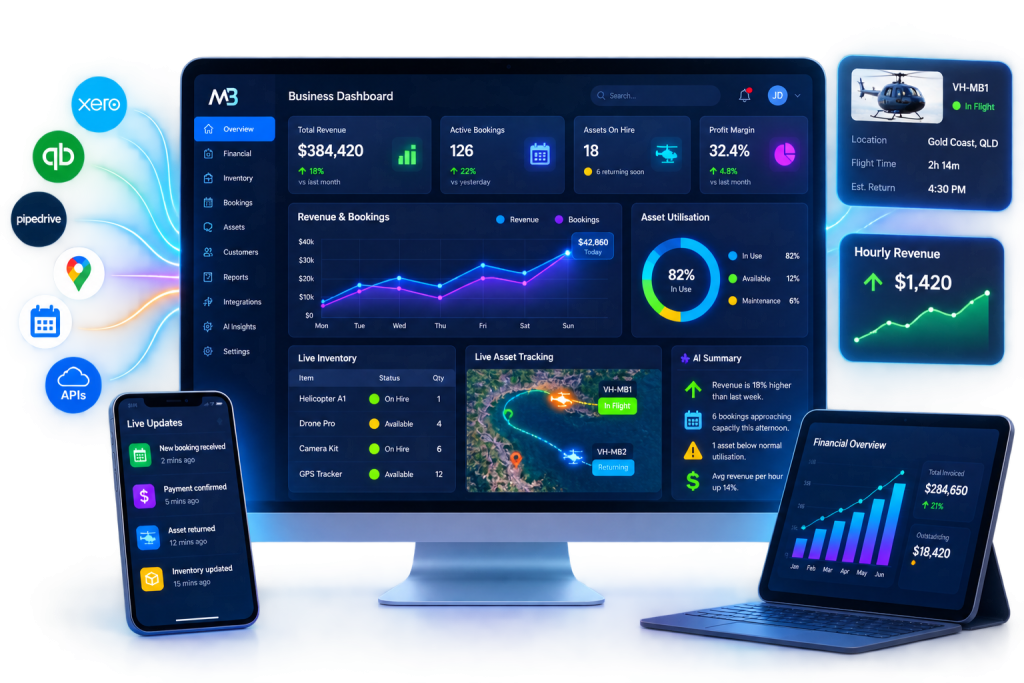
Live Business Data
Bring current information from multiple systems into one dashboard so management can see what is happening without waiting for reports.
Financial Reporting
Connect accounting and operational data to monitor revenue, invoices, costs, utilisation and other important financial metrics.
Stock & Inventory
Monitor stock levels, hired assets, supplier availability and inventory movement across internal and third party systems.
Asset Tracking
Combine GPS, booking and operational information to understand where assets are, how they are being used and what they are earning.
One Dashboard. Multiple Systems. Better Decisions.
We build dashboards around the questions your business actually needs answered.
A useful dashboard is much more than a collection of charts. Behind the interface can be APIs, automated data processing, scheduled polling, calculations, alerts and business rules continuously checking what is happening across your systems.
That means your dashboard can do more than tell you what happened last month. It can show what is happening now, identify discrepancies, calculate performance and help your team spot problems before they become expensive.
From Raw Data to Useful Business Intelligence
Connect your operational, financial and customer data so your team can see the bigger picture.
Connect Your Data
Connect accounting platforms, CRMs, booking systems, supplier APIs, GPS platforms, inventory systems and custom software.
Connect Your SystemsProcess the Information
Apply business rules, calculations and automated checks so raw information becomes meaningful operational data.
Automate Your ReportingSee What Matters
Present the results through a custom dashboard designed around the information your team needs to act on.
Build Your DashboardWhat Can a Custom Business Dashboard Track?
Almost anything your systems can provide can become part of a custom dashboard. Media Booth® combines APIs, integrations, automation and custom development to turn disconnected information into a useful operational view.
Live Performance
Live Financial Reporting
Connect accounting platforms such as Xero with your operational systems to see revenue, invoices, outstanding accounts and other financial information alongside what is actually happening in the business.
Instead of relying entirely on static month end reports, management can have a much clearer view of financial performance throughout the day.
Live Stock Position
Know What You Have and Where It Is
Custom dashboards can continuously compare internal stock information with supplier systems, vendor APIs and accounting platforms to create a clearer picture of availability.
For hire businesses, this can extend to checking which assets are currently out, who has them, when they are due back and whether the relevant hire activity has been invoiced.
Asset Utilisation
Asset 01
4.2 hrs ActiveAsset 02
2.8 hrs ActiveAsset 03
6.1 hrs CompletedTurn GPS Data Into Business Data
GPS tracking becomes much more valuable when it is connected to the rest of your business information. We can combine location data with bookings, customers, assets and financial records.
In one solution, asset movement can be used to identify when an aircraft begins and completes a flight, calculate operating time and match that activity against booking and revenue information to determine hourly revenue and utilisation.
Today's Bookings
Real Time Booking Intelligence
Tourism businesses can bring live bookings, availability, customer numbers, products, revenue and operational activity into one dashboard.
Instead of opening multiple booking platforms or exporting spreadsheets, management can see how the day is performing from a single operational view.
Today's Business Snapshot
Your business is tracking ahead today.
Revenue and bookings are currently above the comparable period, with two operational items requiring attention.
Bookings are 14% above the previous comparable period.
Two products are above 90% capacity this afternoon.
One asset is operating below its normal utilisation range.
Ask AI What Your Data Is Telling You
Once your business information is connected, AI can help turn large volumes of operational data into useful summaries that are much faster to understand.
A dashboard can generate summaries of live bookings, revenue movement, utilisation, unusual activity and other important changes, giving management a quick explanation of what deserves attention.
What Better Business Visibility Can Change
Stop piecing together reports and start seeing the information your business needs in one place.
Faster Decisions
Give management access to current information without waiting for someone to manually prepare another spreadsheet or report.
One Source of Truth
Bring information from different platforms together so teams are not making decisions from conflicting reports.
Find Revenue Leakage
Compare operational activity against invoices and financial records to identify work, hires or transactions that may not have been billed correctly.
Understand Utilisation
Measure how equipment, vehicles, aircraft, staff or other business resources are actually being used.
Spot Problems Earlier
Automatically identify discrepancies, unusual activity and operational issues before they disappear into another monthly report.
Measure What Matters
Build reporting around the metrics that actually drive your business instead of being limited to the reports supplied by individual software platforms.
Dashboards Built for Real Businesses
Not generic reporting templates
From GPS Tracking to Hourly Revenue
Some of the most valuable dashboards we build combine operational, location, booking and financial information that would normally sit in completely separate systems.
For example, GPS data can identify when an operational asset begins and completes an activity. That operating time can then be matched against bookings, customer information and financial records.
The dashboard can automatically calculate utilisation, revenue, operating hours and revenue generated per hour, giving management a live view of how individual assets are actually performing.
The result is not simply another report. It is a management tool built around how the business actually makes money.
Build a Custom Business DashboardAsset Performance
$1,538 / Hour
FAQs About Custom Business Dashboards
A custom business dashboard is a purpose built interface that brings important information from your systems into one place. It can display financial, operational, sales, inventory, booking, customer or asset data depending on what your business needs to monitor.
Yes. Where the connected systems support it, dashboards can receive live information through APIs or webhooks. Other systems can be checked automatically at scheduled intervals so the dashboard remains current without requiring manual updates.
Yes. Depending on your requirements and available API access, Xero data can be combined with information from other systems to provide a broader view of financial and operational performance.
Yes. Where suppliers or vendors provide suitable API access, we can retrieve inventory information and combine it with your own stock data to provide a more complete view of availability.
Yes. A custom system can compare hire or operational information against accounting records and flag discrepancies where expected invoices or transactions cannot be found.
Yes. GPS information can be combined with other business data to monitor asset location, movement, operating time and utilisation. Depending on the application, this information can also contribute to financial and performance calculations.
Yes. AI can be incorporated into suitable dashboards to summarise information, highlight changes and make large amounts of operational data easier to understand. The exact implementation depends on your data, systems and business requirements.
Not necessarily. One of the biggest advantages of a custom dashboard is its ability to sit above existing systems and bring their information together. Where suitable integrations are available, you may be able to keep the software your team already uses.
Find Out About Custom Business Dashboards
"*" indicates required fields
Stop Looking for the Numbers.
Let the Numbers Come to You.
Bring your financial, operational, inventory, booking and asset information together in a custom business dashboard built around the way your organisation actually works.